
Dashboard Widgets
50+ professional widgets to build your perfect trading workspace, from live charts and market data to AI tools, crypto heat maps, and custom embeds.
Custom User Widgets
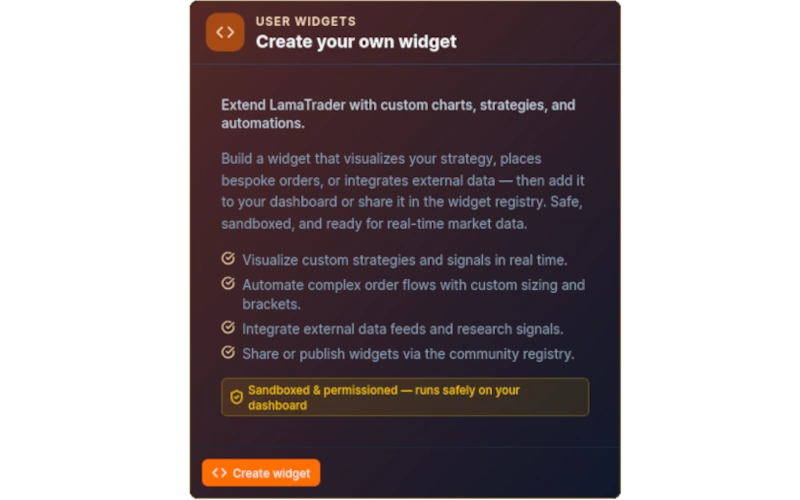
Create Your Own Widget
Extend LamaTrader with custom charts, strategies, and automations. Write code-mode scripts or bring your own logic and embed it directly in your dashboard as a first-class widget.

Custom Iframe Widget
Embed any external web page, chart, video, or document directly in your dashboard via iframe. Useful for pinning proprietary tools, broker portals, or research dashboards alongside your trading workspace.
Custom Web Component Widget
Render arbitrary web components by supplying a module script URL and a custom element tag name. Integrate third-party visualisations or your own UI components without leaving LamaTrader.
Lama Core
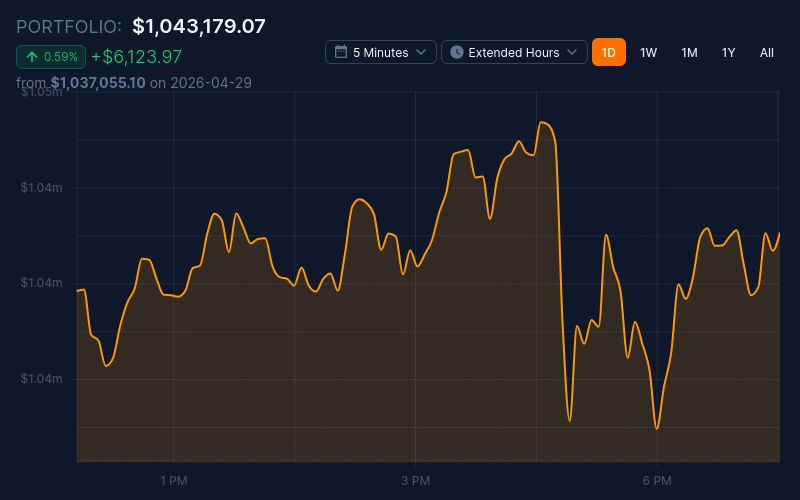
Portfolio History
Chart your portfolio's net liquidation value over time with configurable date ranges. Instantly see how your overall account has grown or contracted across any period you choose.
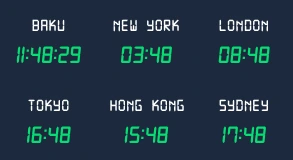
International Clocks
Display live clocks for any combination of global time zones so you always know whether Tokyo, London, or New York is open. Helps you plan entries and exits around international session overlaps.
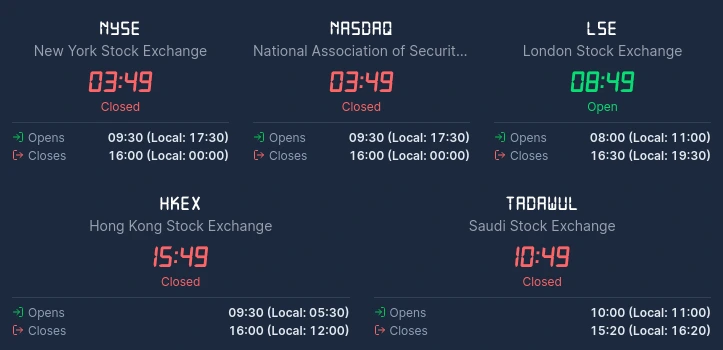
Market Clocks
At-a-glance open and closed status for every major exchange (NYSE, NASDAQ, LSE, TSE, and more). Includes countdown timers to the next open or close so you never miss a session start.
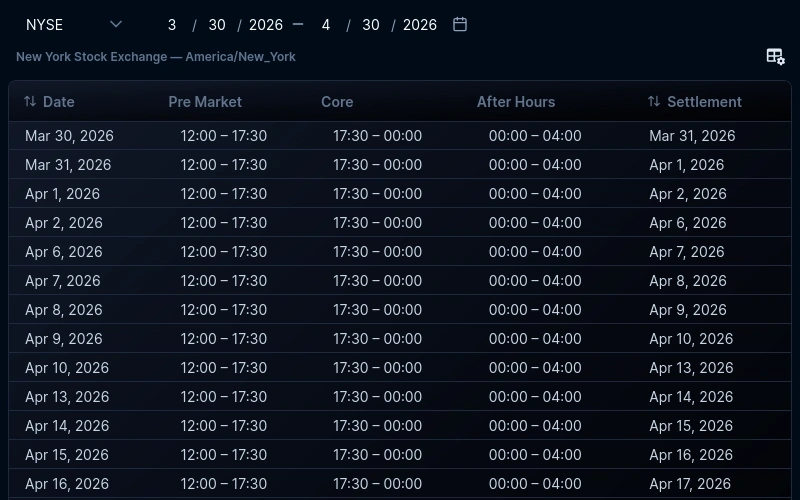
Market Dates
A rolling calendar of upcoming market holidays, early-close days, and key economic release windows. Essential for avoiding surprise closures and scheduling trades around high-impact events.
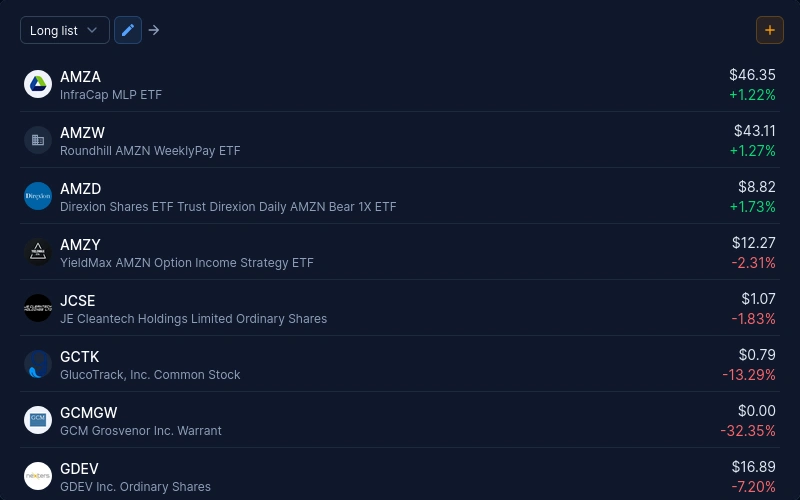
Watchlist Overview
View live quotes, day change, and volume for all symbols across your watchlists in a single scrollable panel. Supports multiple lists with instant switching so you never lose context.
Equity Chart
A dedicated chart tracking your equity curve (total account value minus open position exposure), so you can monitor the health of your portfolio independently of unrealised P&L swings.
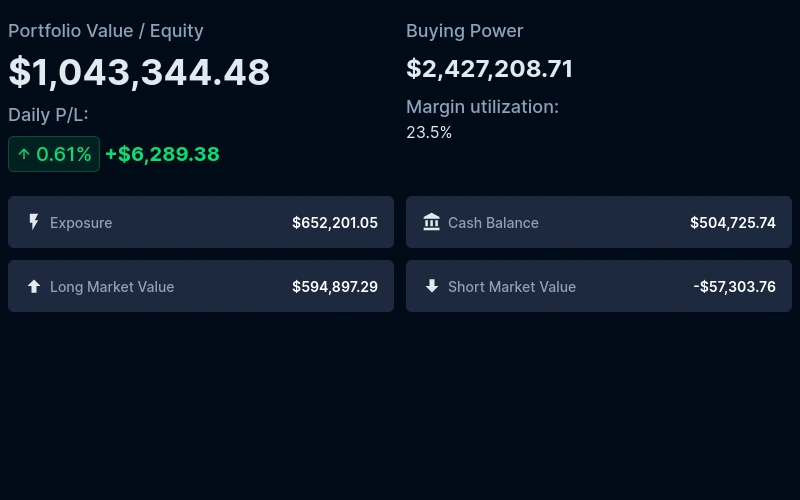
Balance Info
Summarises your account's cash balance, buying power, day-trade buying power, and margin utilisation in a compact card. The fastest way to know whether you have room for a new trade.
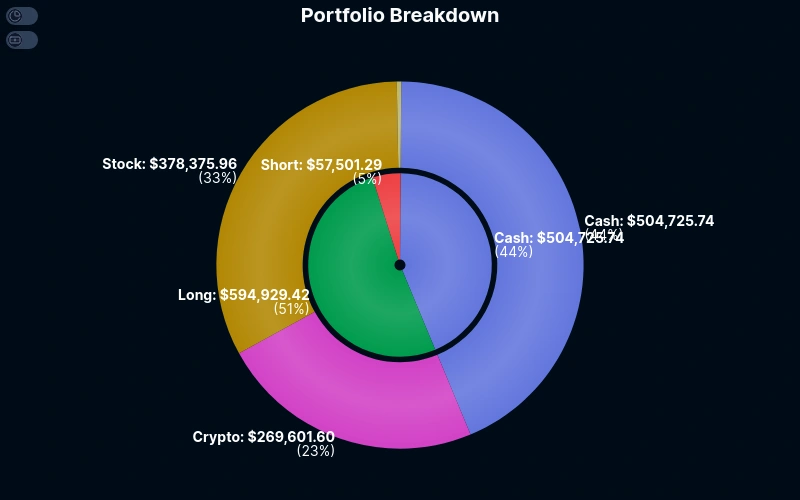
Position Chart
Visualise your open positions as a proportional chart (by market value, unrealised P&L, or allocation percentage), so you can see concentration risk and portfolio shape at a glance.
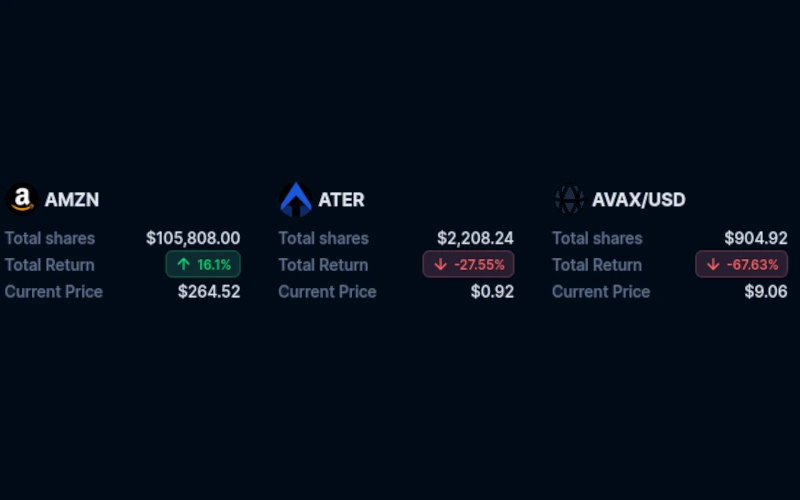
Top Positions
Ranks your current holdings by unrealised P&L, market value, or percentage gain so your biggest winners and losers are always front and centre without digging through a full positions table.
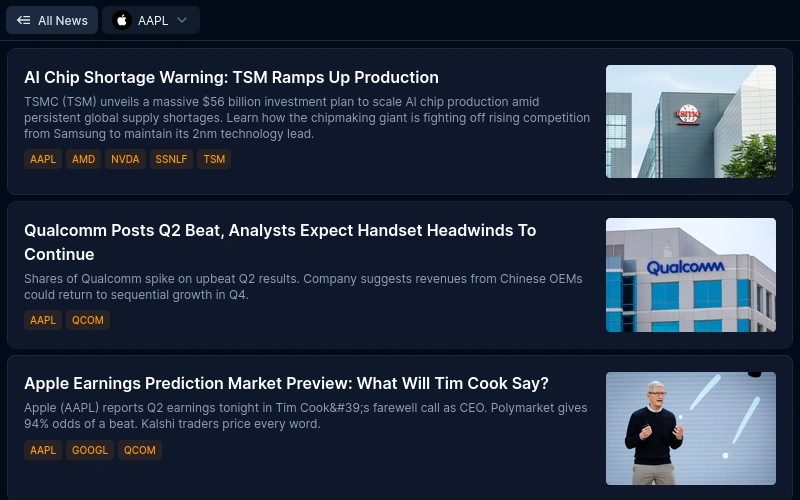
News
A live, filterable news feed pulled from multiple financial data sources. Scope it to your watchlist symbols or the whole market so only relevant headlines reach your dashboard.
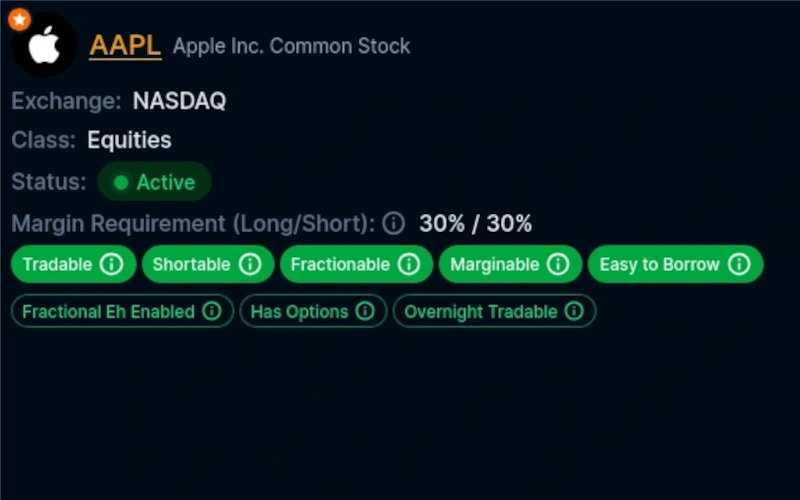
Asset Info
Displays exchange, asset class, status, tradability, and key attributes for any symbol you pin. Essential for quickly confirming whether an asset is marginable, shortable, or fractionable before placing a trade.
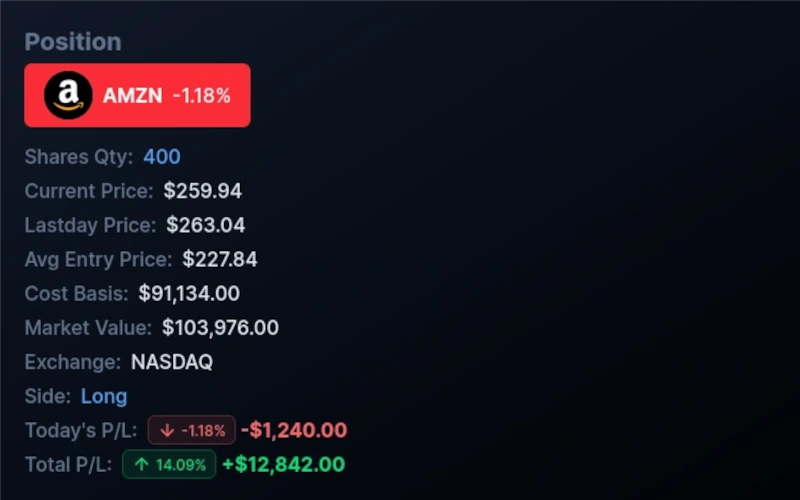
Position Info
Shows full position details for a pinned symbol: entry price, current price, quantity, side, and real-time unrealised P&L. Perfect for monitoring an open trade without keeping the full positions table open.
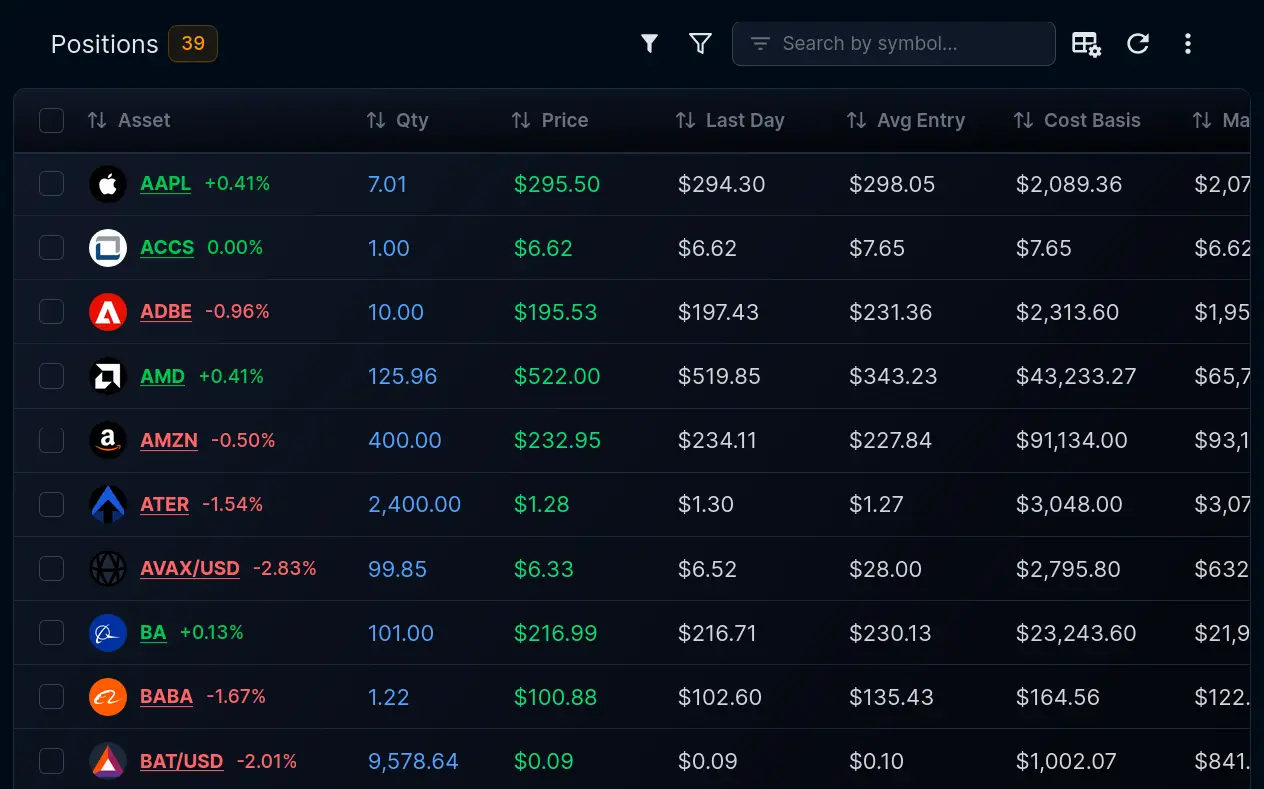
My Positions
A full table of every open position with live market value, quantity, average entry, and unrealised P&L. Sort, filter, and drill into any holding without leaving your dashboard.
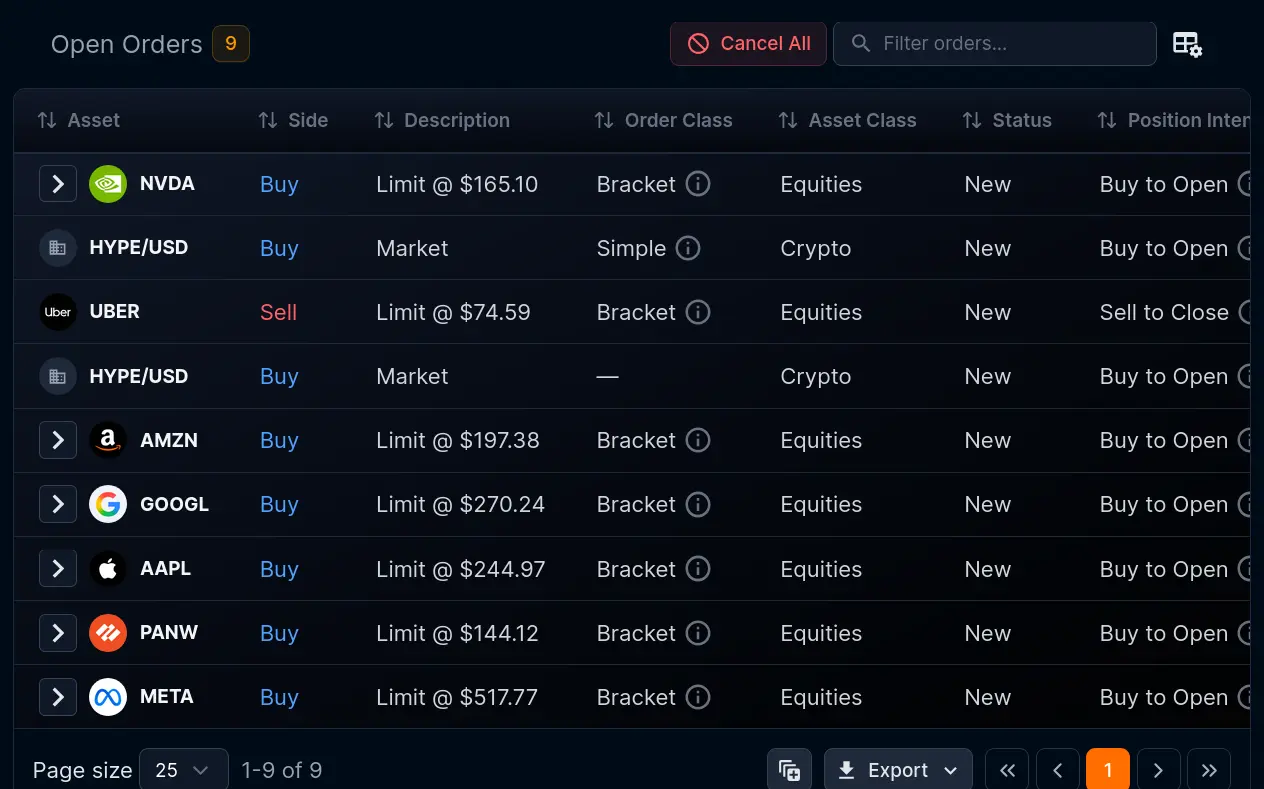
Open Orders
Tracks every working order in one place, with live status, order type, limit and stop levels, and filled quantity. Review or cancel pending orders at a glance during fast-moving sessions.
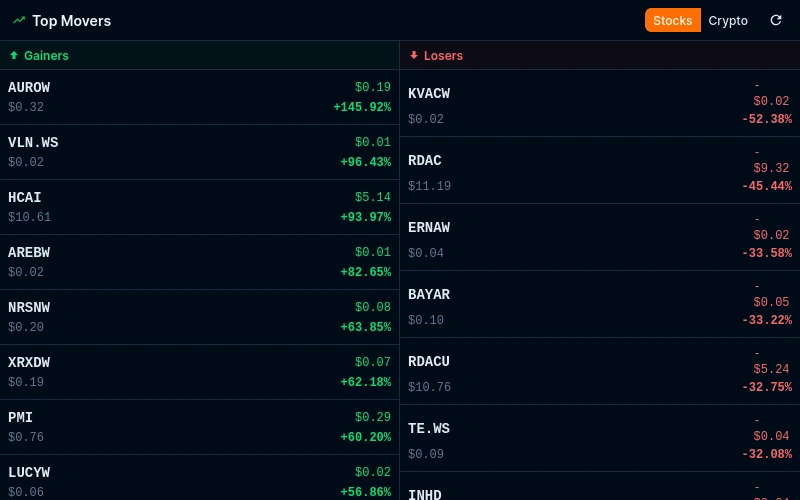
Top Movers
A real-time screener surfacing the biggest percentage and absolute gainers and losers across stocks and crypto. Configurable for different market caps and asset classes to match your trading style.
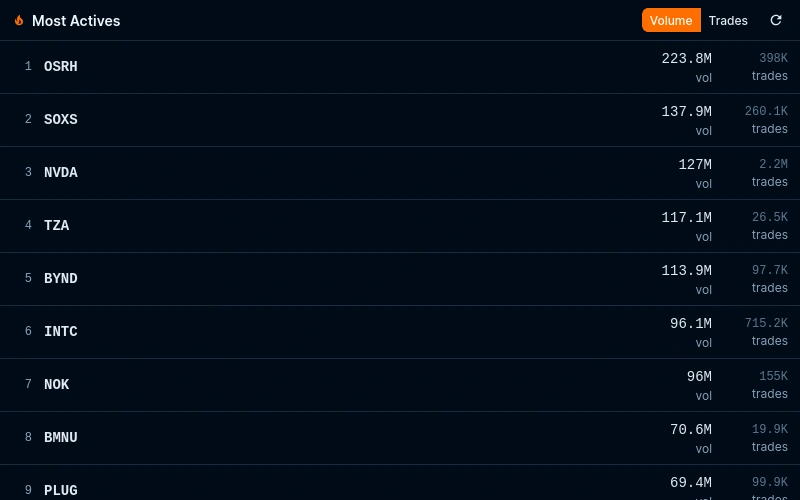
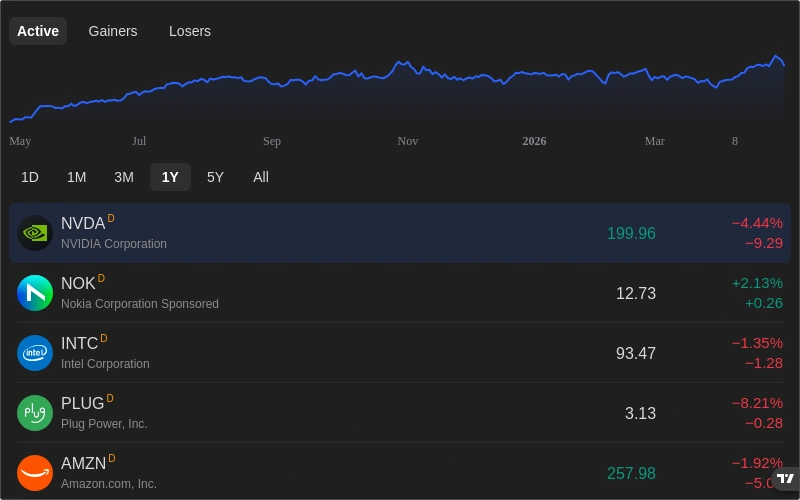
Most Actives
Ranks securities by trading volume in real time so you can spot where institutional and retail flows are concentrating. Covers both stocks and crypto with adjustable universe filters.
Trading & Charts
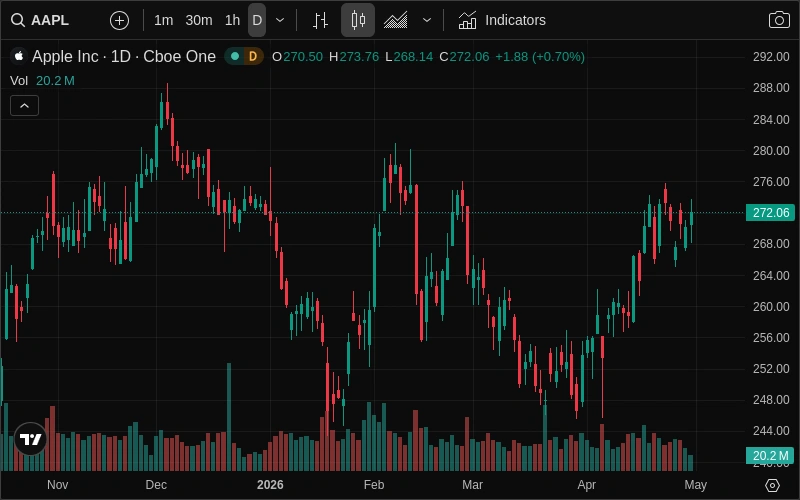
Chart
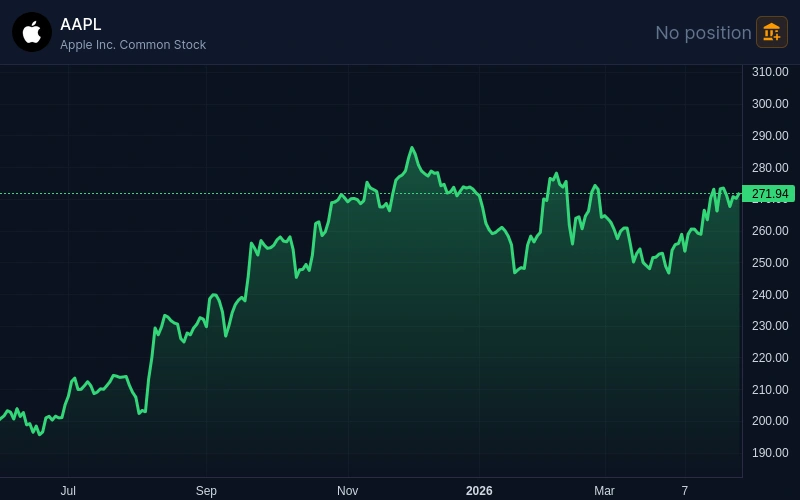
A full-featured interactive trading chart with dozens of technical indicators, drawing tools, and multi-timeframe support. Directly linked to the order entry flow so you can trade straight from the chart.
Mini Chart
A compact single-symbol chart that fits neatly into tight dashboard layouts. Ideal for monitoring a position or index in the corner of your workspace without sacrificing the full chart's power.
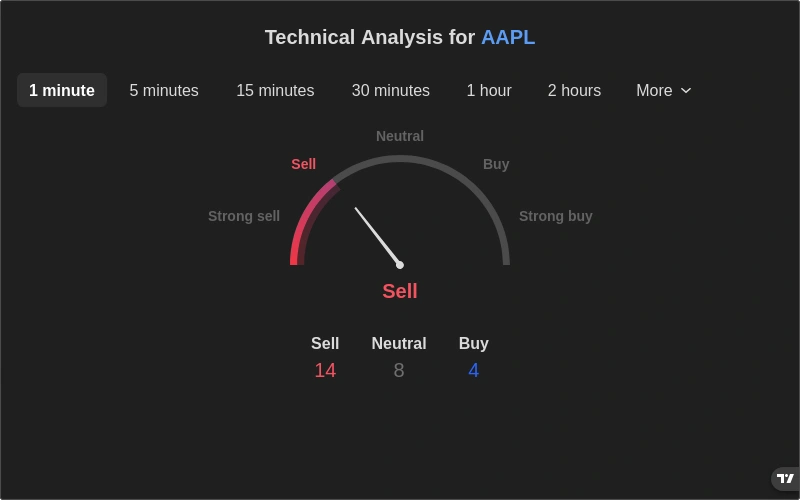
Technical Analysis
Aggregates oscillator and moving average signals into a single buy/sell/neutral summary. Covers multiple timeframes simultaneously so you can confirm confluence before entering a trade.
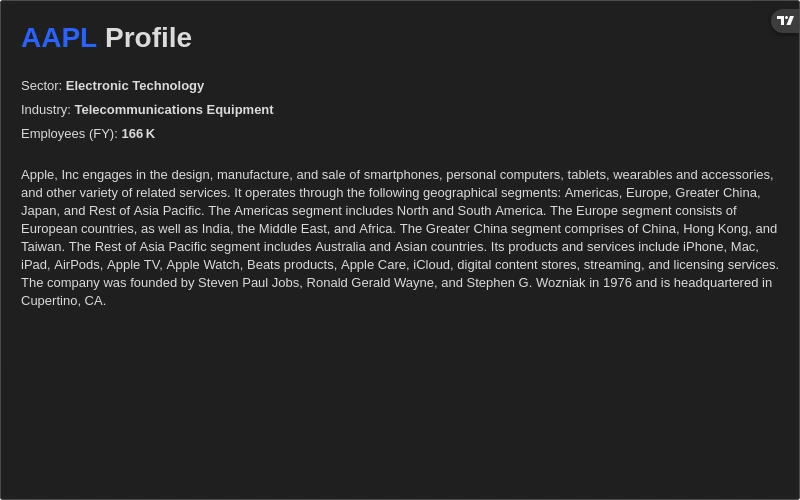
Company Profile
Shows a company's sector, industry, description, key executives, and website in a structured card. Useful for quick fundamental context when screening or doing pre-trade due diligence.
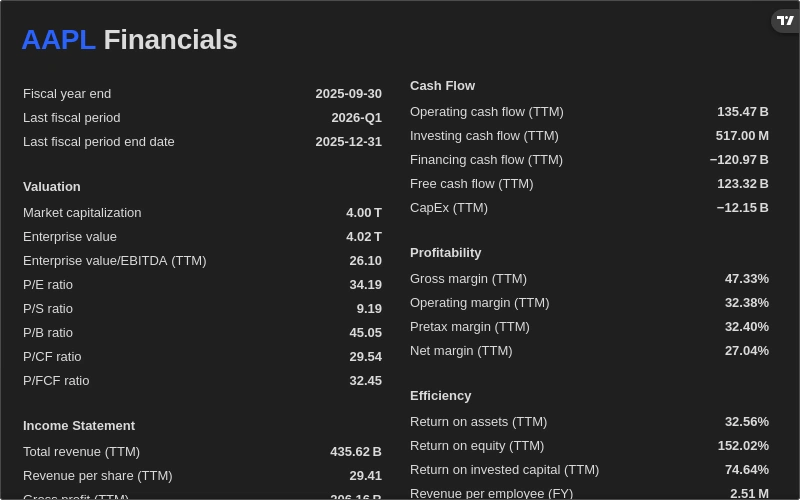
Fundamental Data
Displays earnings per share, P/E ratio, revenue, profit margin, and other key financial metrics in a structured layout. Complements technical analysis with the balance-sheet context that moves stocks over longer time horizons.
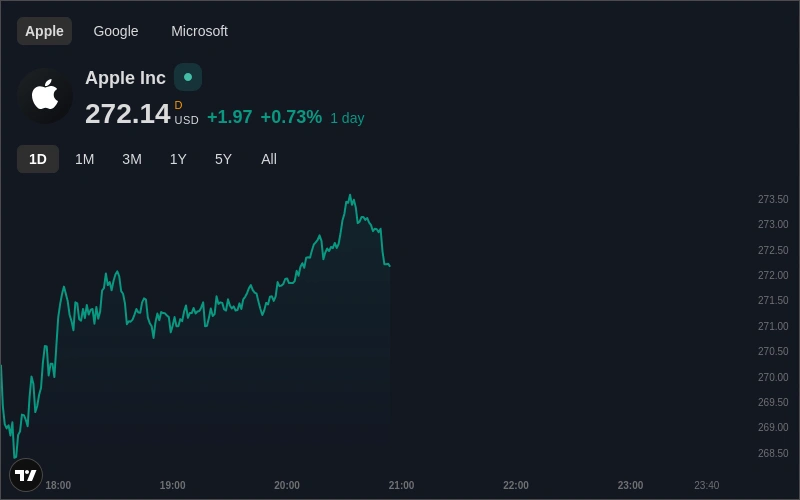
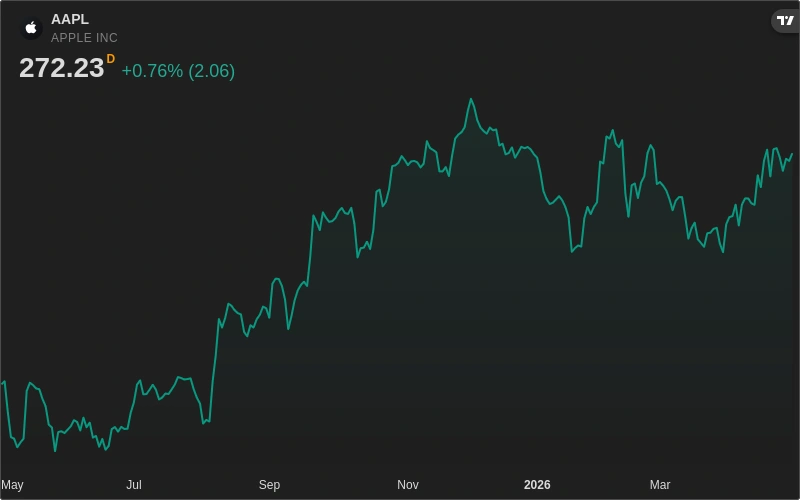
Symbol Overview
Combines a sparkline, current price, and day-change percentage into a minimal overview card. Supports multiple symbols side-by-side so you can track a small basket without a full chart per symbol.
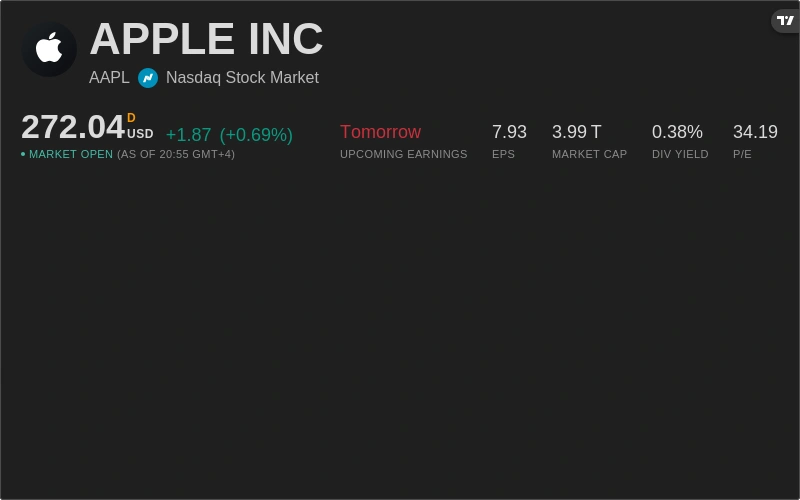
Symbol Info
Presents the full exchange-reported details for a symbol, including last price, bid/ask, day range, 52-week range, and average volume, in a clean reference panel.
Market Data & Overview
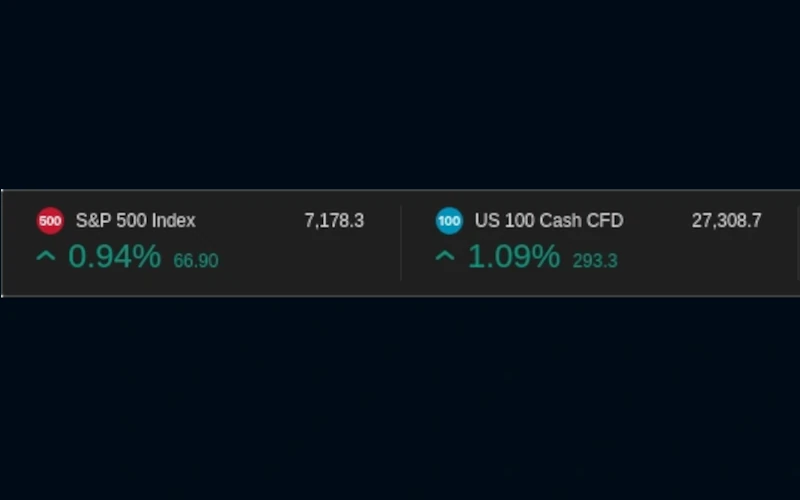
Market Data
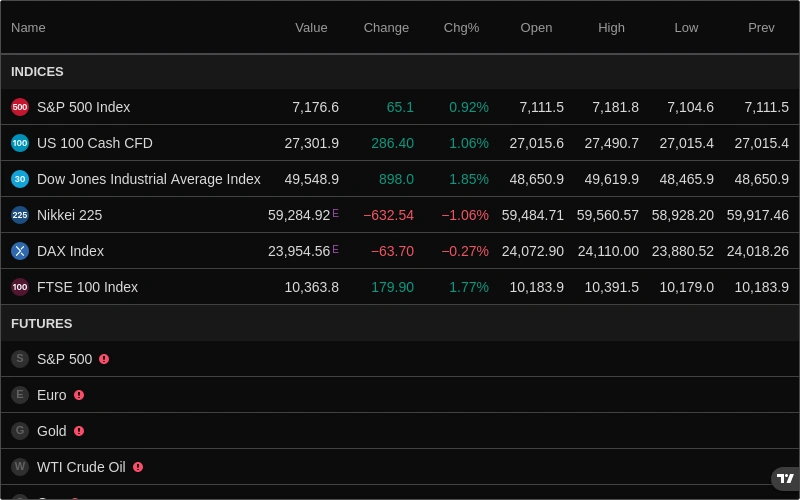
A real-time snapshot of major indices, futures, bonds, and forex pairs in a single configurable table. Gives you the macro pulse of the market as soon as you open your dashboard.
Market Overview
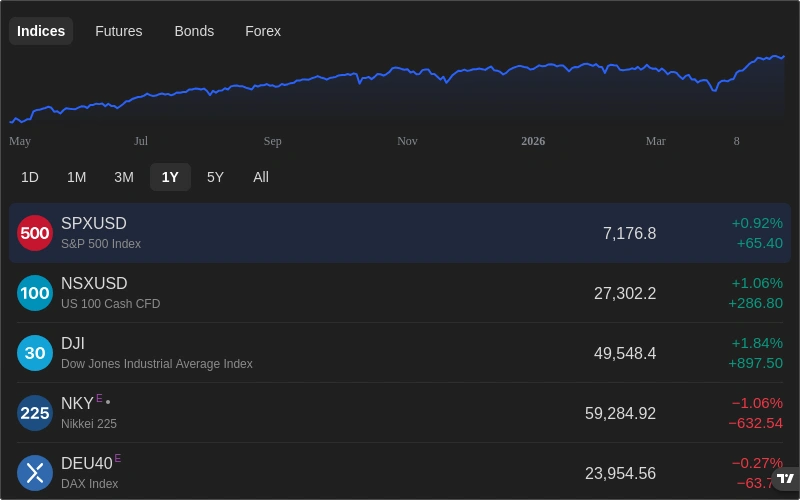
Groups equities, futures, forex, and crypto performance into tabbed sections so you can sweep across asset classes with one click. Includes colour-coded percentage changes to surface sector rotation at a glance.
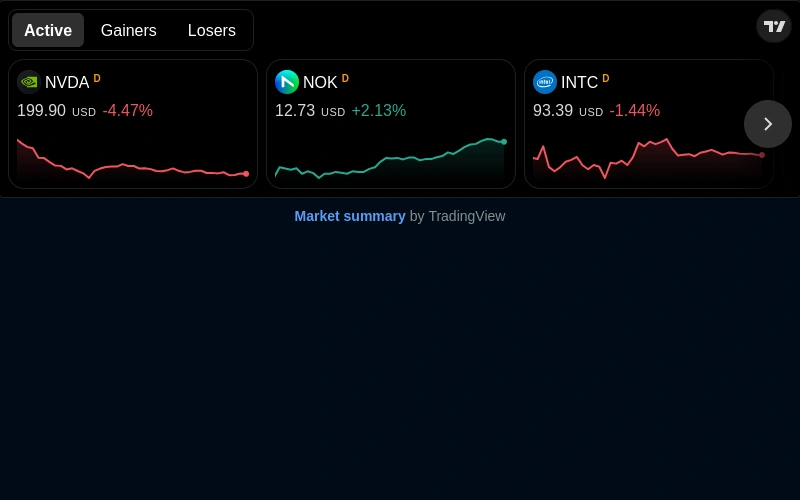
Market Summary
TradingView's web-component market summary widget, surfacing aggregate breadth, advance-decline ratios, and sector performance in a compact embeddable format.
Stock Market
A leaderboard-style view of stock market performance by sector and index, colour-coded by return. Useful for identifying which corners of the market are leading or lagging on any given day.
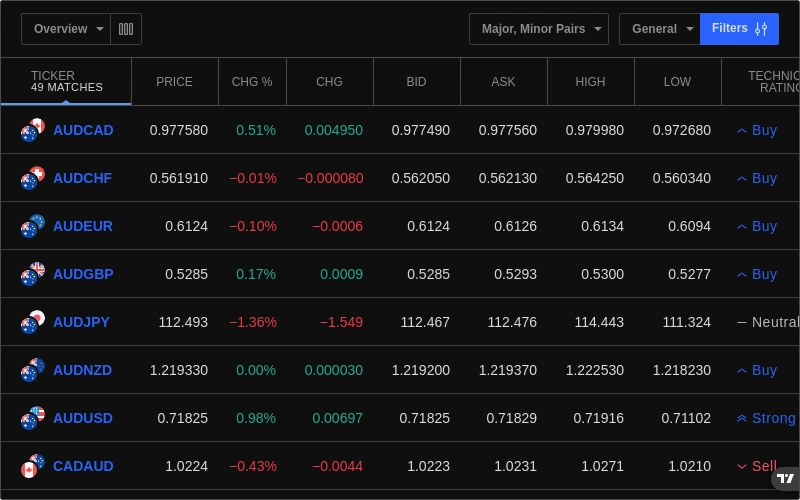
Screener
Filter thousands of stocks and crypto assets by technical rating, fundamental metrics, price, volume, and volatility. Save custom scan criteria and re-run them any time from the dashboard.
Ticker Tape
A horizontally scrolling banner showing live prices and percentage changes for a configurable list of symbols. Keeps key assets visible without occupying significant vertical screen space.
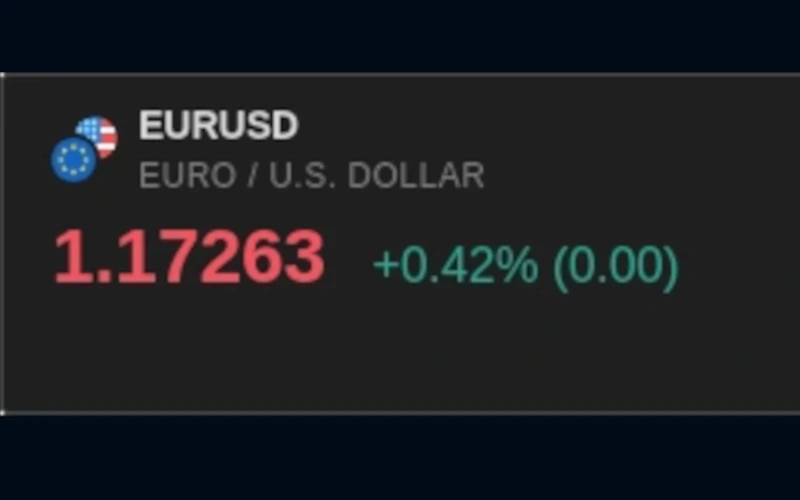
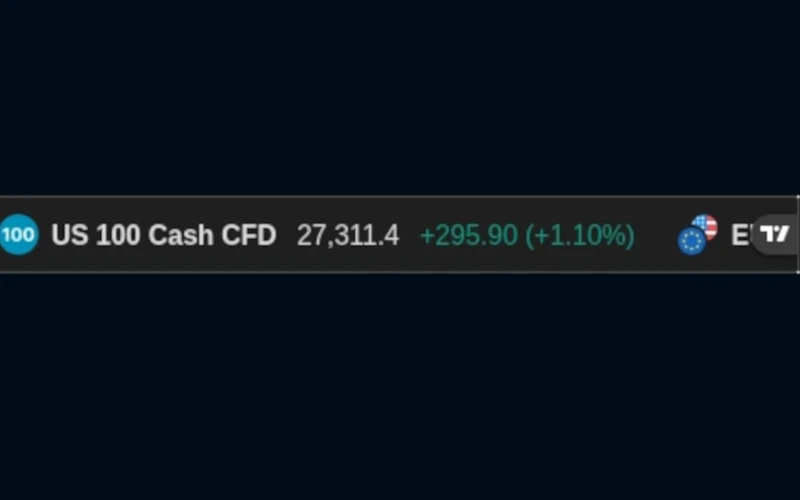
Single Ticker
A focused price card for one symbol (showing current price, day change, and a sparkline) that can be pinned anywhere on your dashboard for instant reference.
Ticker
Displays a customisable set of tickers with live price data in a compact multi-row format, ideal for tracking a curated watchlist without a full market-overview panel.
Analysis & Research
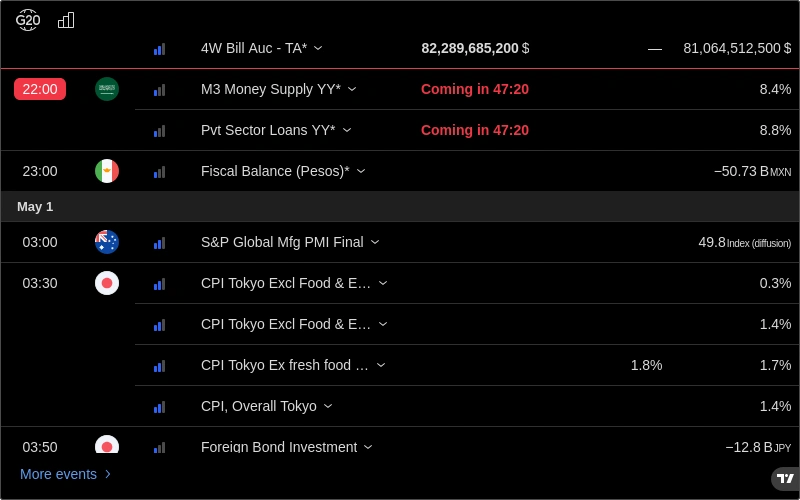
Economic Calendar
Lists upcoming economic releases (GDP, CPI, NFP, Fed decisions, and more) with consensus and actual values filled in as they land. Filter by country and impact level to focus on the events that move your markets.
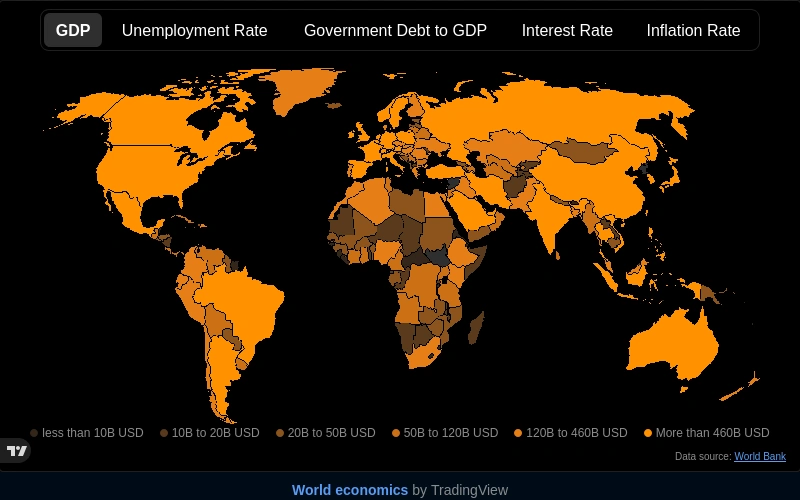
Economic Map
TradingView's interactive heat map of global economic indicators by country, letting you visualise macro health across regions at a glance and spot emerging opportunities or risks early.
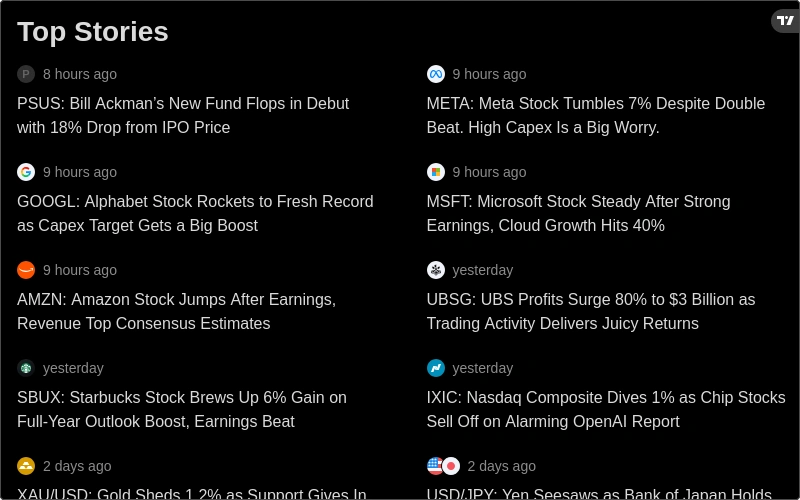
Top Stories
Aggregates the most-read and most-recent financial news stories from across TradingView's editorial network. Ideal for catching major macro narratives and sentiment shifts without leaving your workspace.
Stock, Crypto & Forex
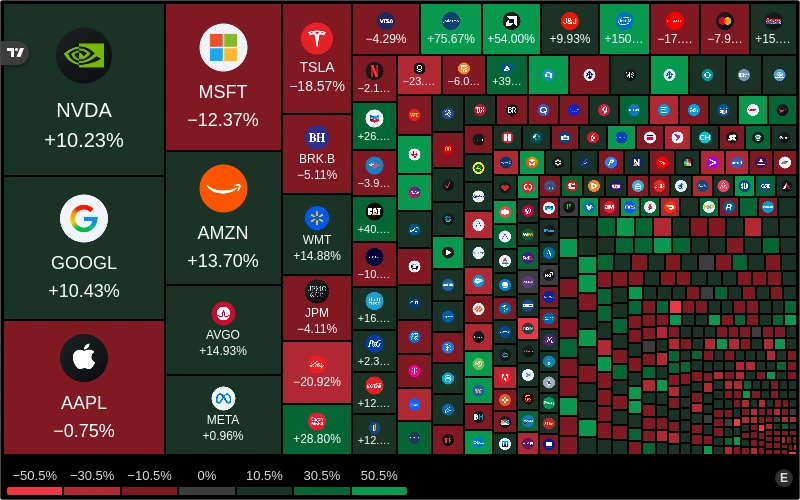
Stock Heat Map
Renders the S&P 500 and other indices as a proportional colour heat map, with each tile sized by market cap and coloured by performance. Immediately reveals which sectors and stocks are driving or dragging the index.
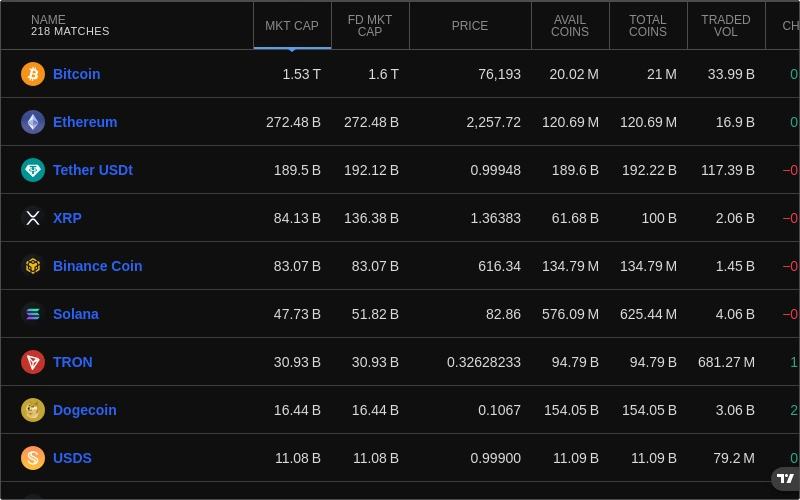
Crypto Market
A live overview of the top cryptocurrencies by market cap, showing price, 24-hour change, and volume in a sortable table. The fastest way to survey the crypto landscape without a dedicated exchange tab.

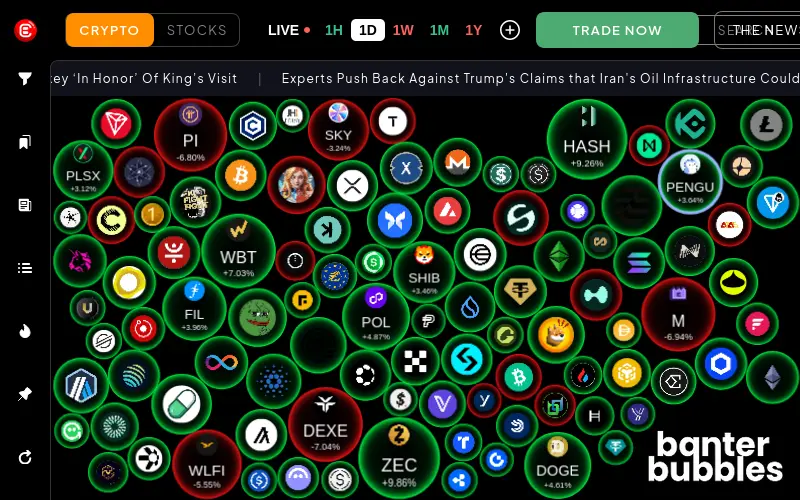
Crypto Heat Map
Visualises crypto market performance as a proportional heat map grouped by layer-1, DeFi, and other sectors. Spot which corners of the crypto market are running hot or cooling off in real time.
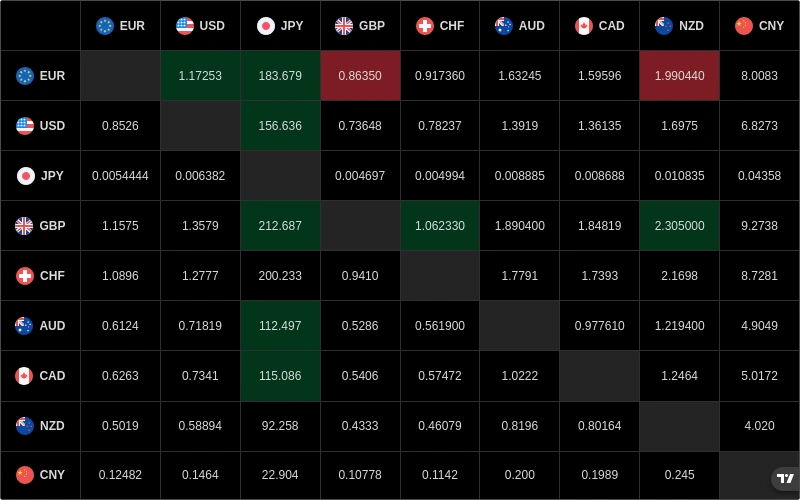
Forex Cross Rates
Displays a currency cross-rates matrix showing the exchange rate of every major pair combination in a compact grid. Instantly see relative currency strength without flipping through individual pairs.
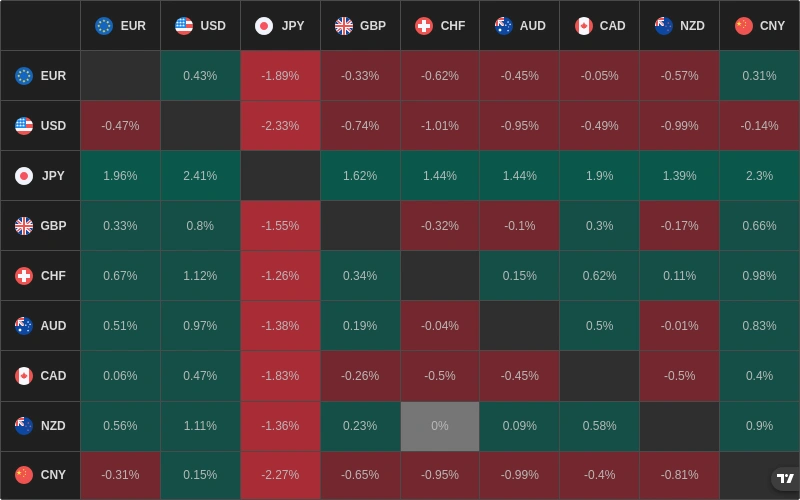
Forex Heat Map
Colour-codes currency strength across all major pairs so you can see at a glance which currencies are broadly strong or weak. Helps confirm directional bias before taking a forex position.
Stock & Crypto Data
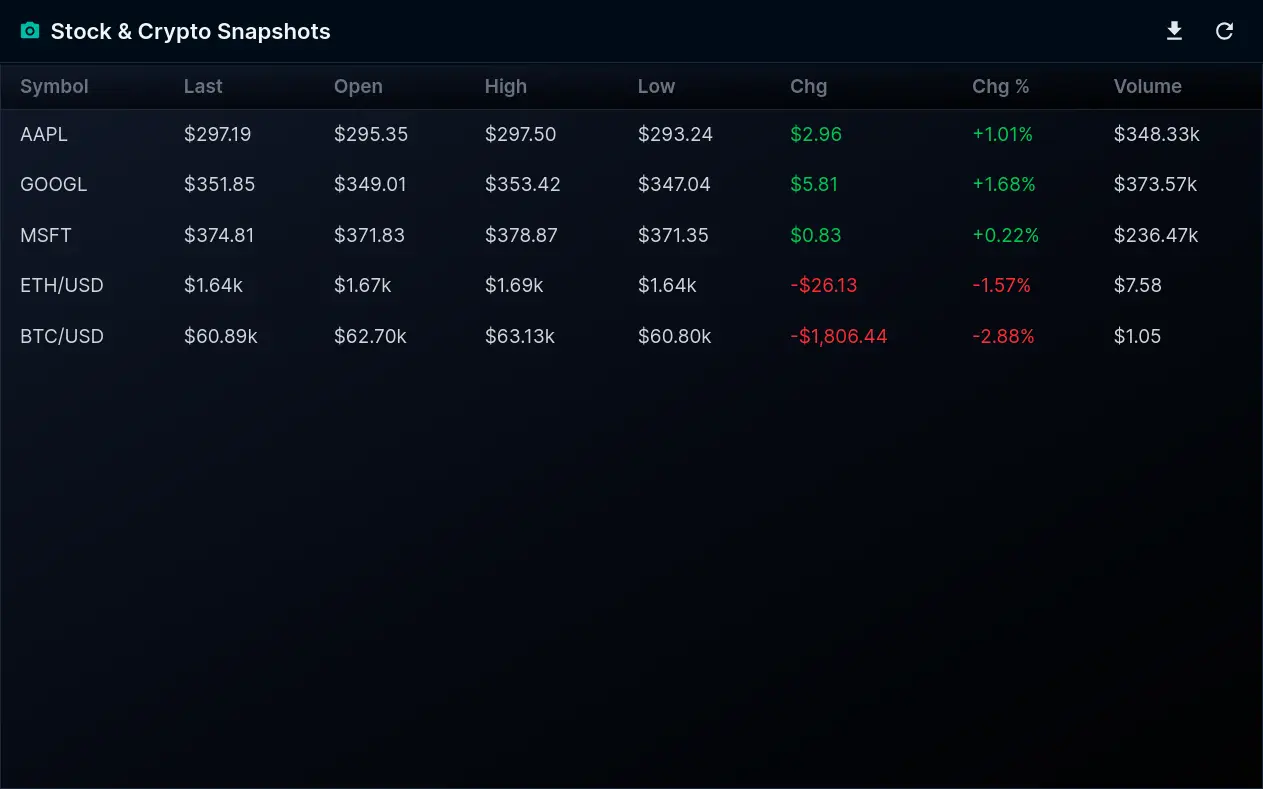
Stock & Crypto Snapshots
A compact per-symbol snapshot pairing the latest price with the day's open, high, low, previous close, and volume. Track a basket of stocks and crypto side by side in real time.
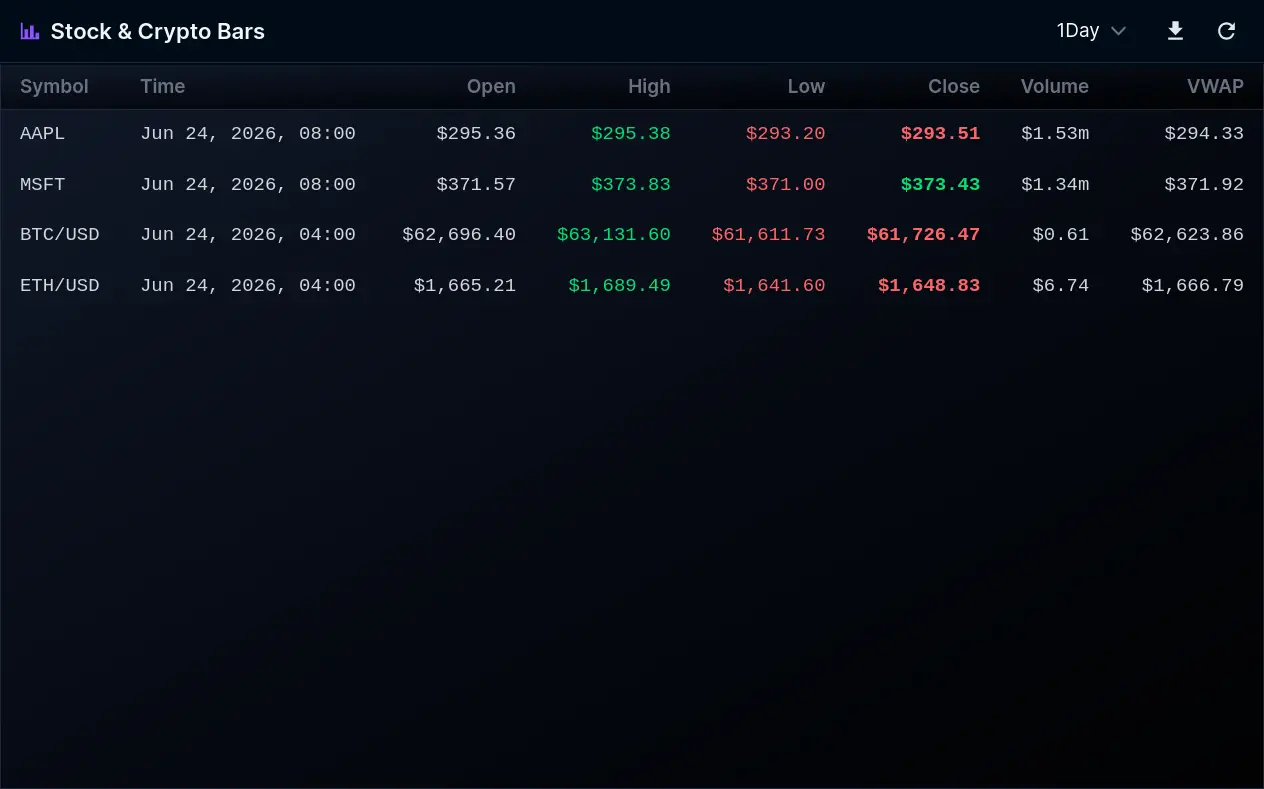
Stock & Crypto Bars
Streams OHLCV bar data for any mix of stock and crypto symbols across timeframes from one minute to one month. Build custom views of price action without opening a full chart.
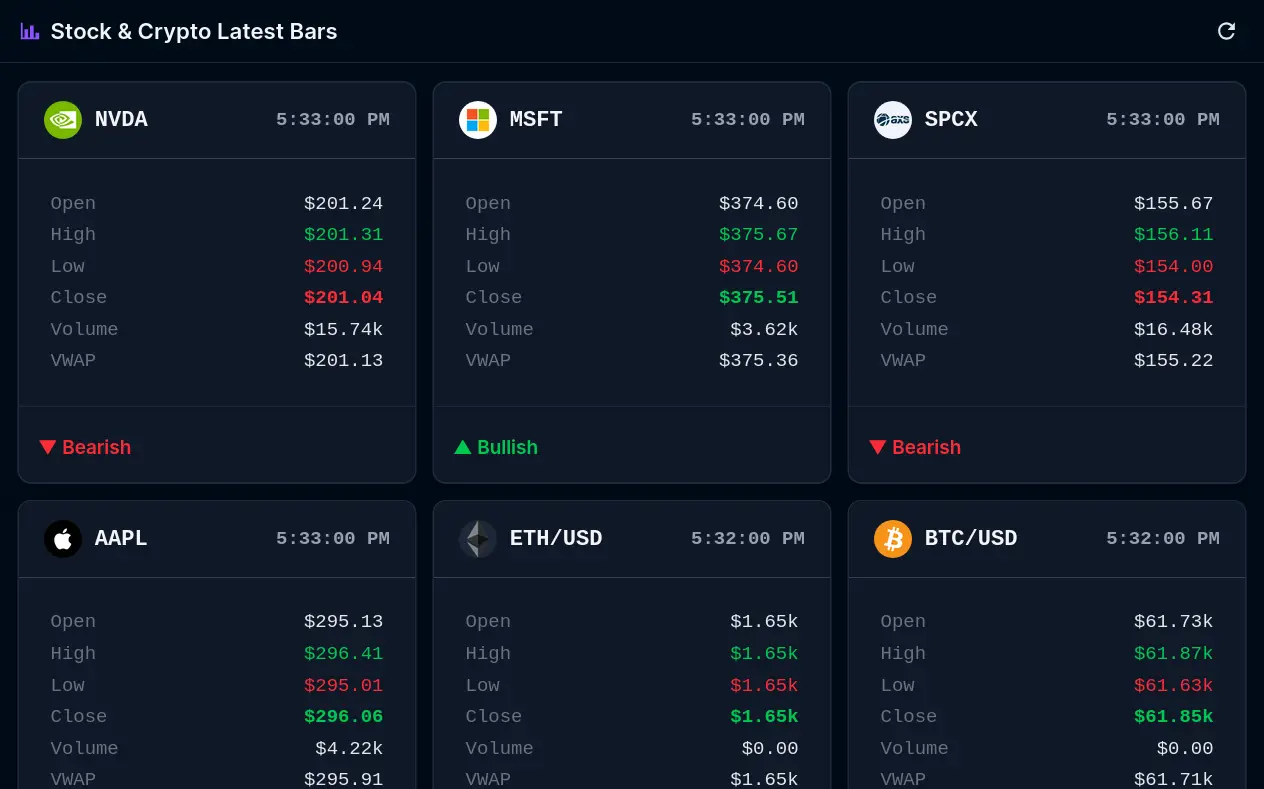
Stock & Crypto Latest Bars
Shows the most recent completed OHLCV bar for every symbol you follow. A lightweight way to keep current open, high, low, close, and volume in view across many assets at once.
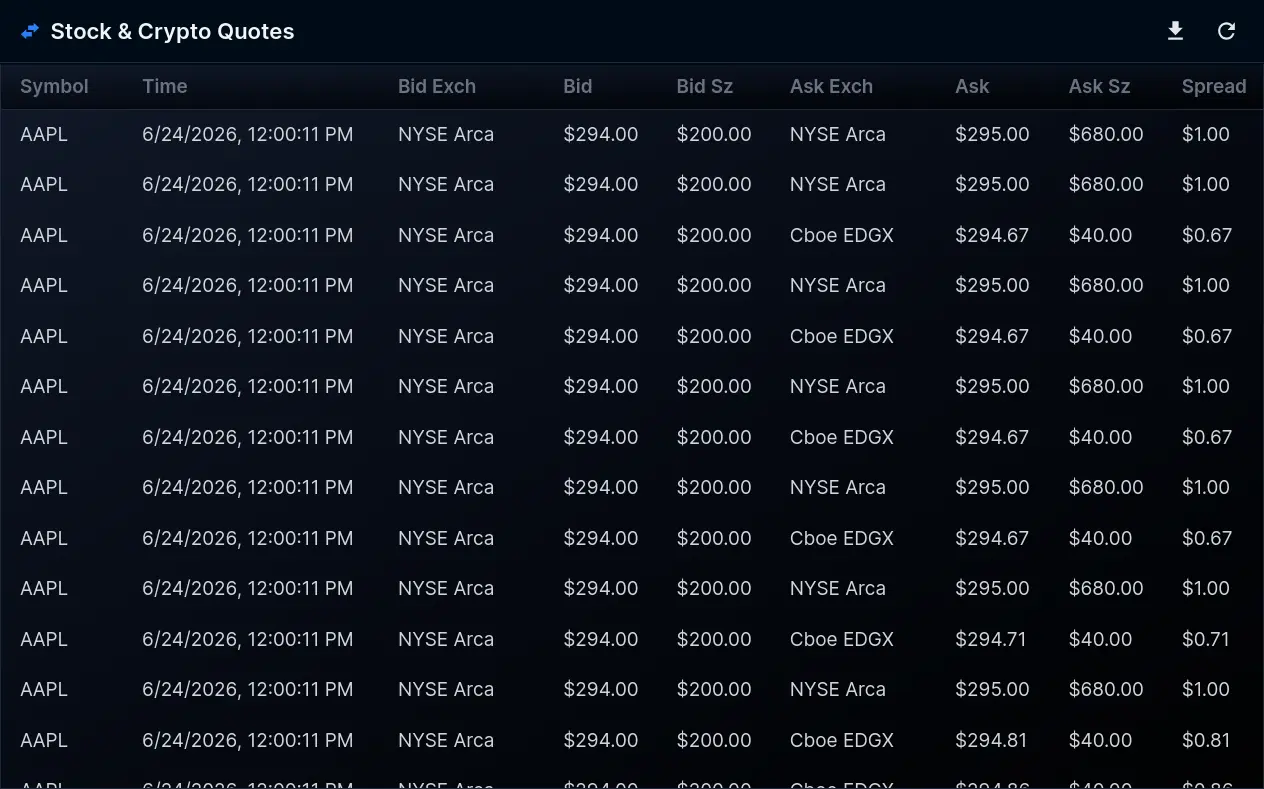
Stock & Crypto Quotes
A rolling history of recent bid and ask quotes for your chosen stock and crypto symbols. Useful for reading spread and liquidity before sizing an order.
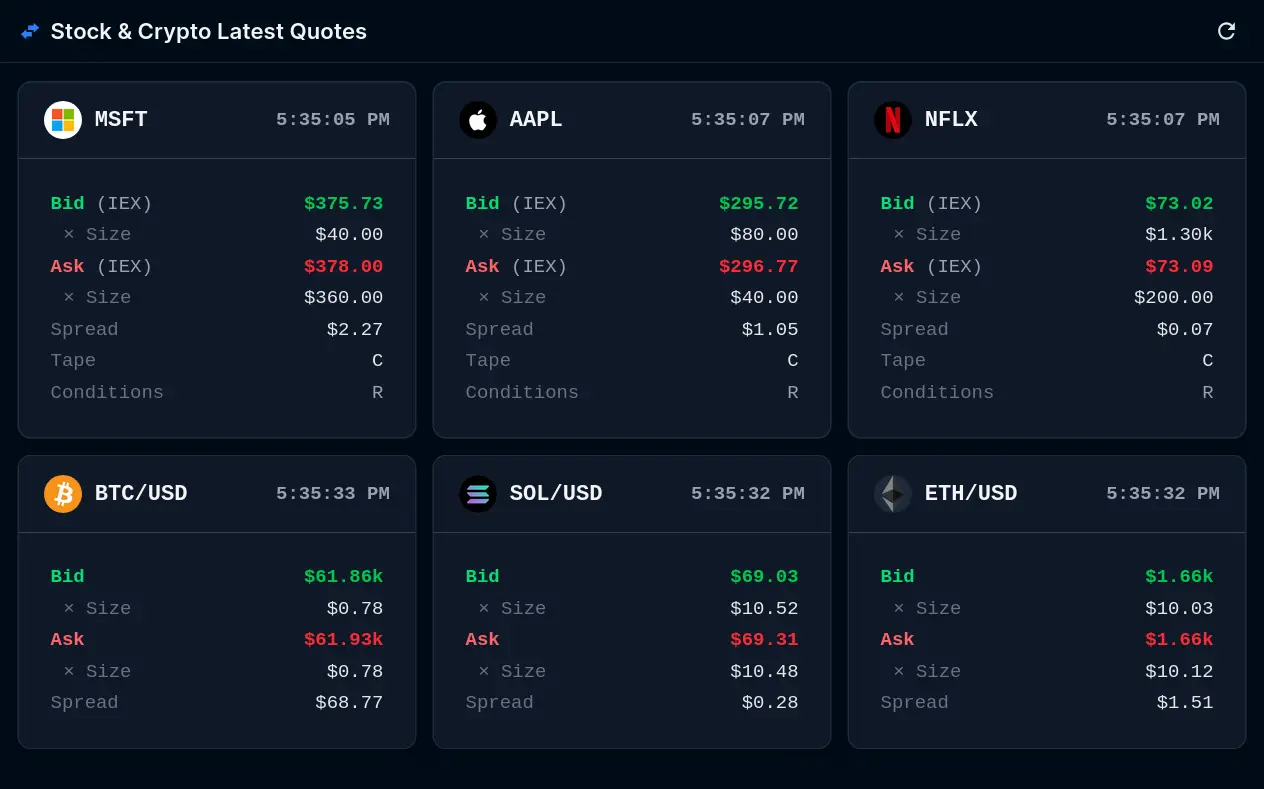
Stock & Crypto Latest Quotes
The current best bid and ask for each symbol you track, updating in real time. The fastest way to read the spread across a watchlist of stocks and crypto pairs.
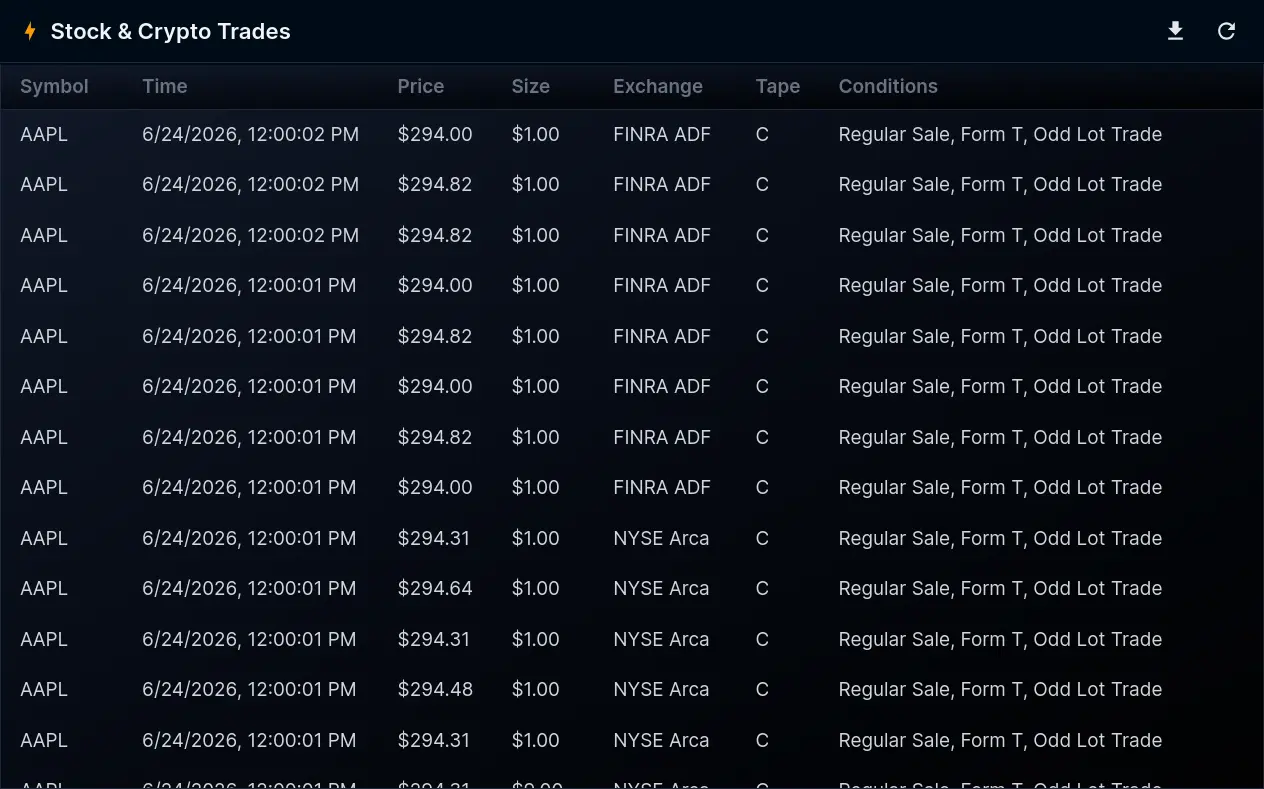
Stock & Crypto Trades
A live tape of recent prints for your selected stock and crypto symbols, with price, size, and time. Watch the flow of actual executions as they hit the market.
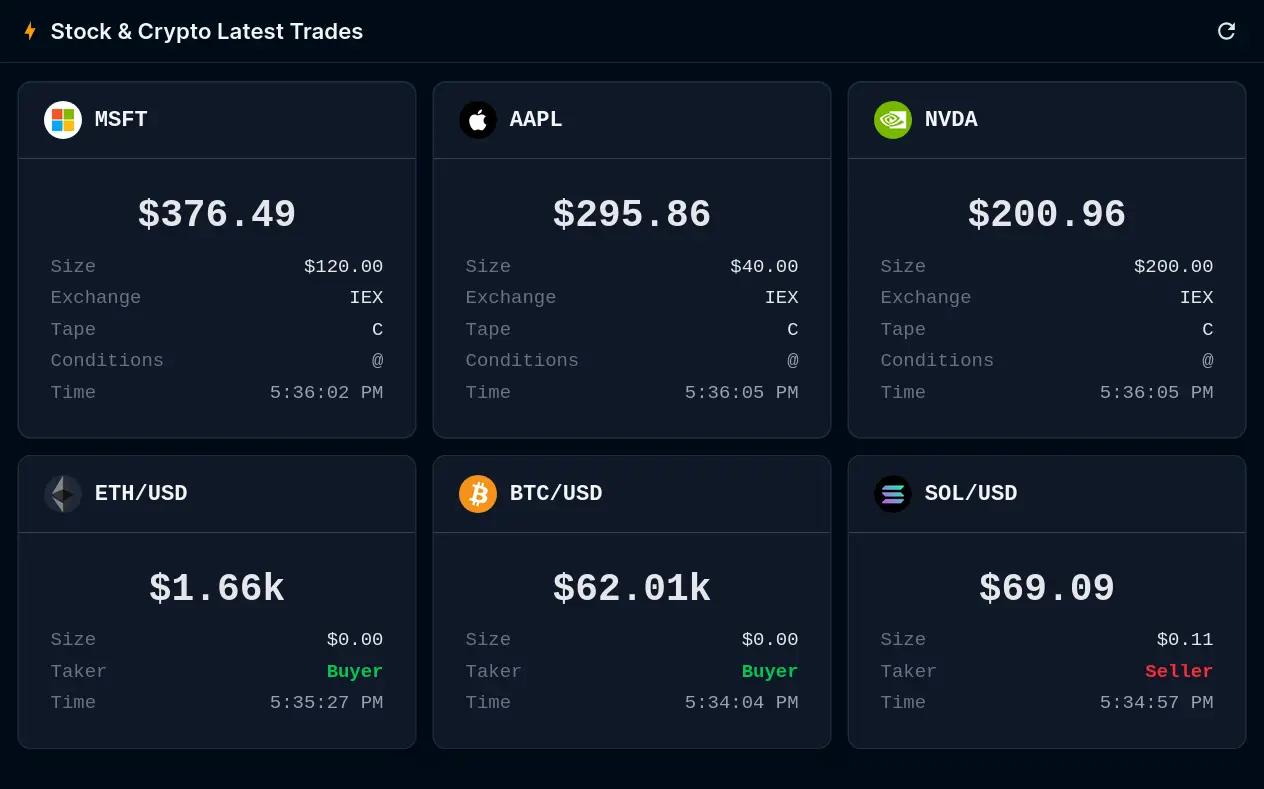
Stock & Crypto Latest Trades
Displays the most recent trade for each symbol you follow, with price and size. A clean way to confirm where an asset last printed across a whole basket.
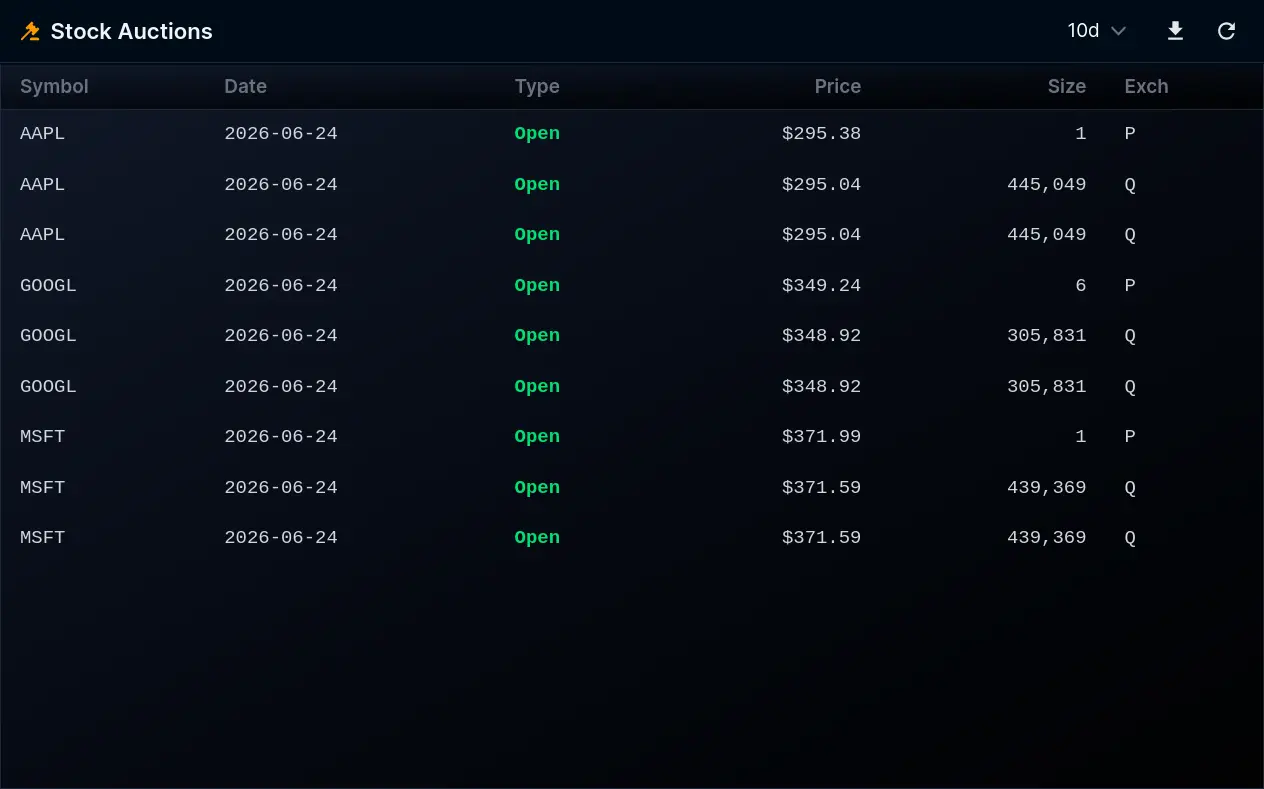
Stock Auctions
Surfaces official opening and closing auction prices for your chosen symbols across recent sessions. Valuable for traders who anchor decisions to the day's auction levels.
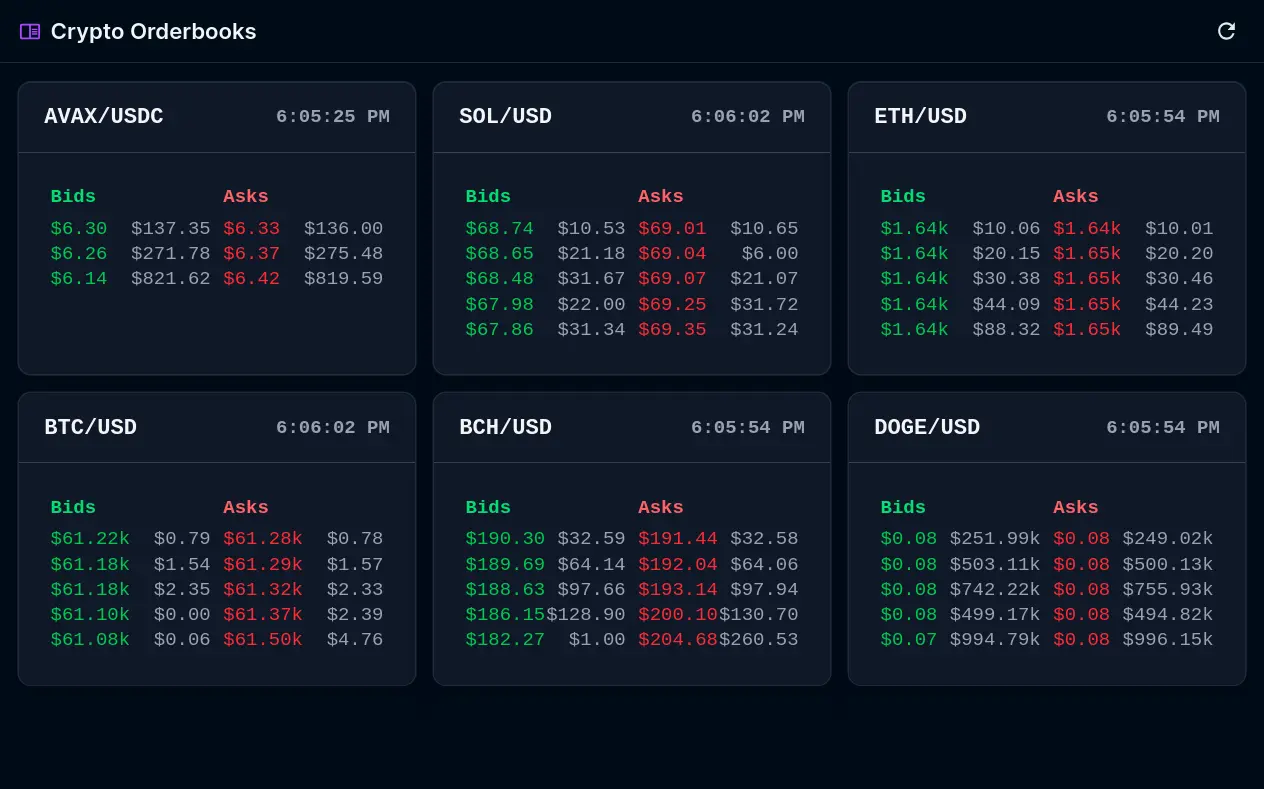
Crypto Latest Orderbooks
Shows live orderbook depth for major crypto pairs, with the top bids and asks on each side. See where liquidity is stacked before entering or exiting a position.